Can a vision model watch tail -f? I tested it on DGX Spark (it can't, but this works)
AI engineering is just process engineering. — Greg Alton
We all break everyday work into a task list. That's an algorithm. In AI, that task list is a skill. The steps are run by scripts called tools. Skills plus tools (and memory) make an agent. And an orchestrator manages a group of agents for long-running tasks: the overnight ones you hear about. (In practice, most long-running tasks weren't planned properly and are mistakes. But some are exactly what you want.)
One of the most compelling uses I've found for local models is log monitoring. Parsing, storing, and analyzing logs would take a human hours. A local model does it in minutes, over and over, while you sleep. You wake up to who's been probing your server, or a cert that's about to expire. I also route event notifications to different people, so they don't have to read summaries at all.
A typical pipeline of mine looks like this: connect to the VPN, run an ssh script, navigate to the log, collect the raw output every hour, parse it, store it in a database, and let the orchestrator make sense of it and store transaction patterns for faster matching next time. I've had success with Gemma 4 and the NVIDIA Nemotron family.
Then I hit a wall. One server produced more than 1 million lines an hour, and streaming its logs spiked the CPU. Vision models are really good now, so I wondered: could one just read a tail -f terminal, the way I would? I bought my DGX Spark to learn by doing, so I tested it. Here's the honest write-up. Spoiler: it can't keep up, but I found a pattern that does.
- Time
- About 30 minutes
- Checked
- Tools
- vLLM, NVIDIA DGX Spark playbooks, tmux
If a button name on the screen does not match this guide, follow the action. These products rename buttons often. This is an advanced guide: it uses code, and each technical term is explained the first time it appears. Model names and prices change, so check the linked docs before you ship.
Steps
The test setup
I didn't want to find out on a production server, so I built a fair test on the Spark:
- Synthetic logs at 10k, 100k, and 1M lines per hour: made-up SIP, sshd, nginx, media-proxy, and TLS lines, with 5 planted incidents in each 3-minute run: an SSH brute force from one IP (20 s), a burst of HTTP 5xx errors (20 s), a single cert-expiry warning, a single FATAL line, and a 36-second ramp of WARN lines.
- The "screen":
tail -n0 -Frunning in a headless tmux pane (200×50). Each frame is atmux capture-panerendered to a plain monochrome PNG. Capture plus render takes about 40 ms, and there's no color highlighting to help the model. - The model: nemotron-3.5-super-vl (Nemotron 3.5 Super VL, 120B total / 12B active parameters, NVFP4), served by vLLM on the Spark.
- The prompt: "Read this terminal and return JSON": incidents (type, source, count, severity), the error rate, and a few notable lines.
- Scoring: an incident counts as detected if the model names its type while it's happening (or within 45 s). Precision counts everything the model reported against that window.
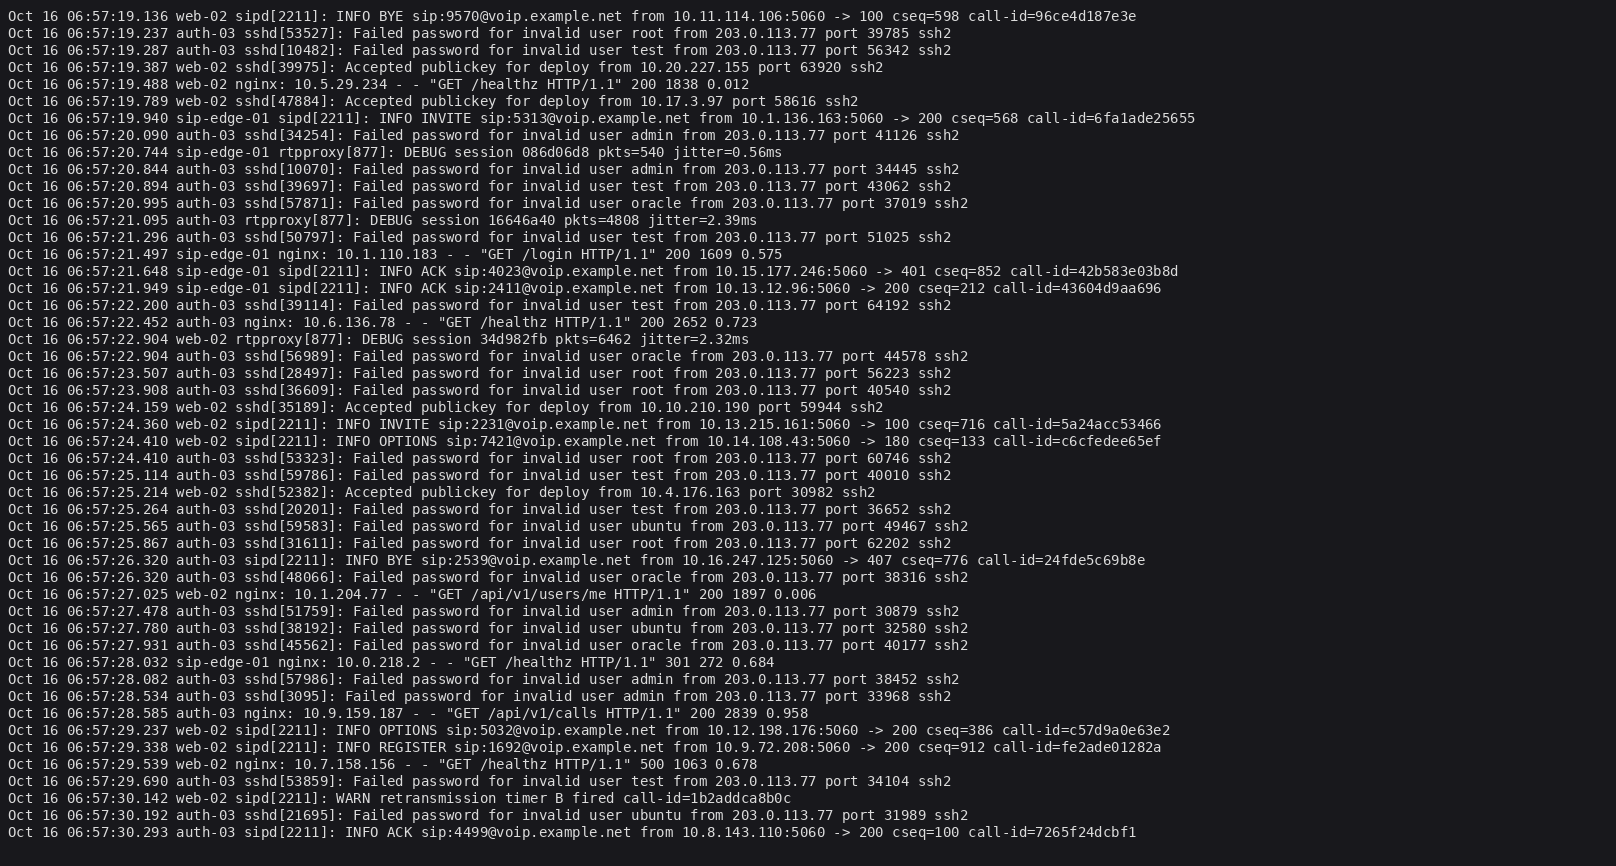
Here's what a frame looks like at 10k lines an hour, during the SSH brute force. All hosts, addresses, and domains are made up:
The results
Mode Lines/hour Seconds per frame (avg) Lines never on screen Incidents caught (of 5) Precision Vision only 10k 4.8–5.5 s 0.1–3.5% 5 0.56–0.68 Vision only 100k 6.1–6.4 s ~70% 3–4 0.44–0.62 Vision only 1M 6.3–6.6 s ~97% 2 0.37–0.40 Hybrid (counters + vision every 5 s) 10k 3.5 s 0% 5 (in 0–4 s) 0.91 Hybrid 100k 4.4 s 68% 5 (in 0.3–11 s) 0.65 Hybrid 1M 4.5 s 95% 5 (in 0.1–3 s) 0.55 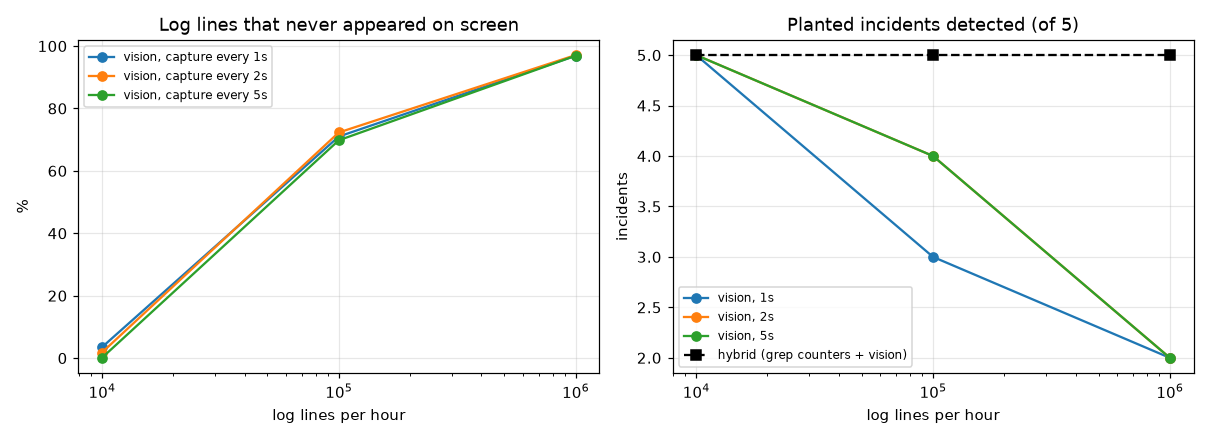
Reading the screen works fine at about 10k lines an hour (roughly 3 lines a second). Above that, it falls apart.
Why screen-reading fails at volume
- The model is the bottleneck. Each frame takes about 5–6.5 seconds (around 1,640 image-plus-prompt tokens in, 200–320 out). So you get roughly one frame every 6 seconds no matter what capture interval you ask for. Asking for 1, 2, or 5 seconds made almost no difference.
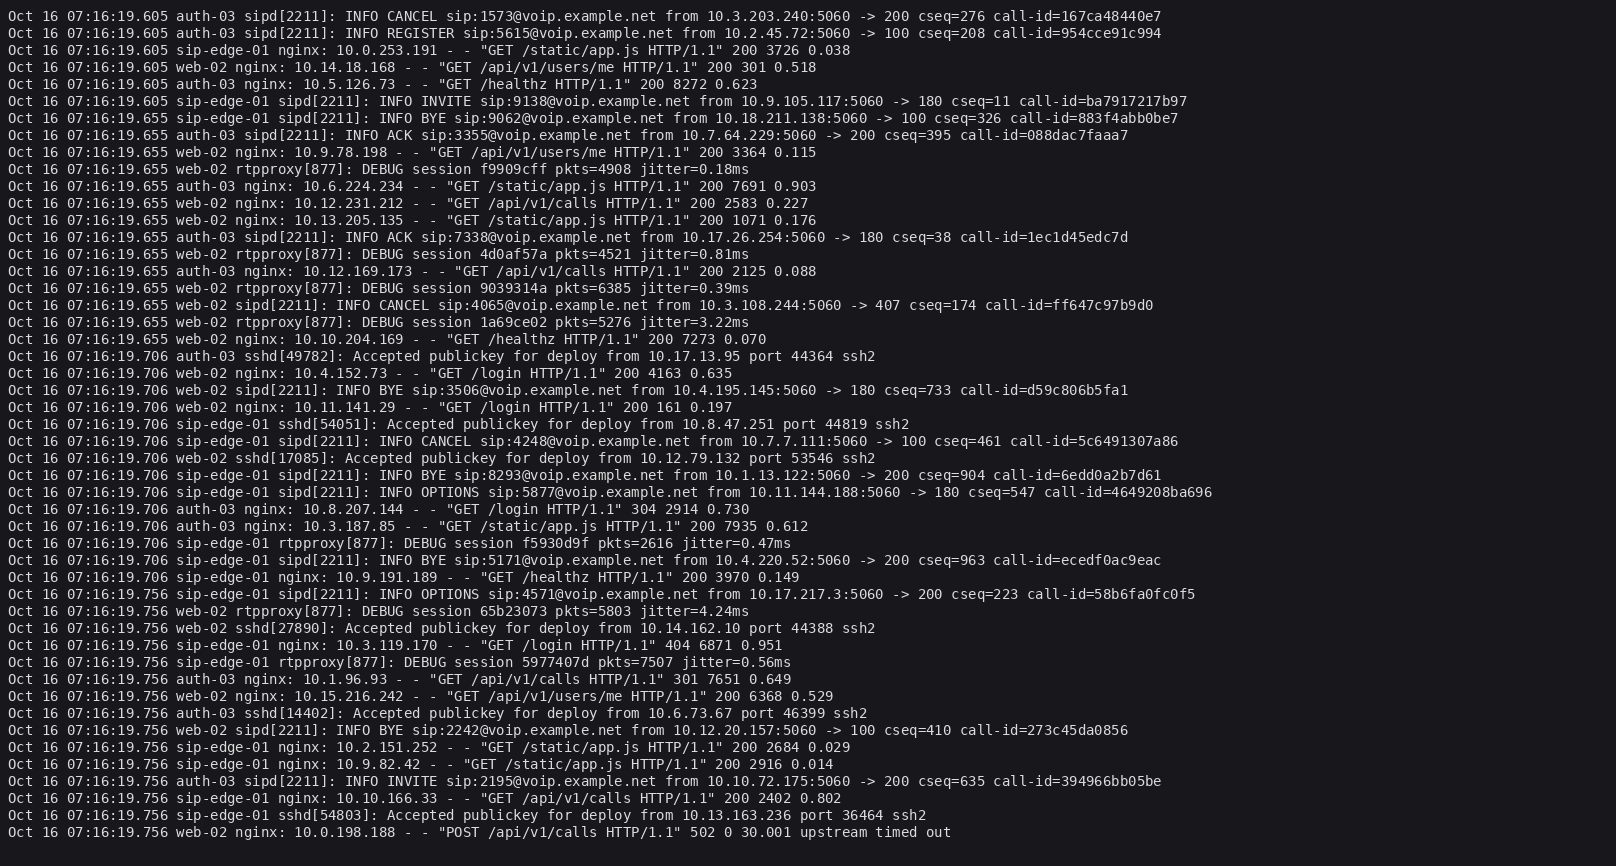
- Most lines never reach the screen. A 50-row terminal shows 50 lines. At 1M lines an hour, about 1,700 lines scroll past between frames, so about 97% are never seen. The single FATAL line and the cert warning were missed at 1M/h because they scrolled by between frames.
- It misreads. The model sometimes copies lines wrong: wrong process names, changed IDs, "ssh certificate" instead of "ssl certificate." It also called one or two normal 500 errors a "storm," and at 1M/h it treated the normal background of WARN lines as a "warning ramp." That's why precision is low.
- The JSON breaks. 10–25% of responses weren't valid JSON (fewer in hybrid mode, where answers were shorter).
This is a 1M-lines-an-hour frame. It's a busy screen, and it's already gone by the time the model answers:
The surprise: streaming wasn't the CPU problem
This whole test started because streaming a 1M+ lines/hour log spiked the CPU. So I measured a plain streaming baseline: piping 1M lines an hour into a Python regex parser averaged 0.4% CPU (peak 2%). At about 280 lines a second, the raw byte rate is small, around 40 KB/s. The whole proof of concept used about 5% of system CPU at every rate.
So the stream itself is cheap. If shipping raw logs spiked the CPU, the likely cause is the per-line work on the receiving side (or much bigger bursts than I tested), not the stream. That's worth knowing before you redesign anything. (I ran this baseline over a local pipe rather than SSH, so the SSH overhead isn't included.)
The recipe that works: counters plus a model
Put a tiny counter next to the log. It reads every line, counts patterns, and sends only numbers and alerts. In my test the counters used 0.26 seconds of CPU in total over 3 minutes at 1M lines an hour, and they caught all 5 incidents within 0–3 seconds (the slow WARN ramp took up to 11 seconds at 100k/h). Here's a generic version:
import re, subprocess, time, collections

PATTERNS = {
    "ssh_bruteforce": re.compile(r"Failed password .* from (\S+)"),
    "http_5xx": re.compile(r'" 5\d\d '),
    "cert_expiry": re.compile(r"certificate .* expires in (\d+) days"),
    "fatal": re.compile(r"\bFATAL\b"),
    "warn": re.compile(r"\bWARN\b"),
}
THRESHOLDS = {"ssh_bruteforce": 10, "http_5xx": 20, "cert_expiry": 1, "fatal": 1, "warn": 200}
WINDOW = 10  # seconds

def watch(path, on_trip):
    tail = subprocess.Popen(["tail", "-n0", "-F", path], stdout=subprocess.PIPE, text=True)
    counts, recent, start = collections.Counter(), collections.deque(maxlen=50), time.time()
    for line in tail.stdout:
        recent.append(line.rstrip())
        for name, rx in PATTERNS.items():
            if rx.search(line):
                counts[name] += 1
        if time.time() - start >= WINDOW:
            tripped = [n for n, c in counts.items() if c >= THRESHOLDS[n]]
            if tripped:
                on_trip(tripped, dict(counts), list(recent))
            counts.clear(); start = time.time()
When a counter trips (and also every N seconds, for context), hand the model a 50-line sample and ask it to explain: who's probing, what kind of errors, how bad. Text is the better input: the same 50 lines cost fewer tokens and can't be misread. Use a screenshot only when a screen is all you have (a console, a vendor GUI, a dashboard). Both work through an OpenAI-compatible endpoint:
import base64, json, requests

API = "http://localhost:8000/v1/chat/completions"   # your vLLM server
MODEL = "your-vision-model"
ASK = ("These log lines tripped counters: {tripped} {counts}. "
       "Return JSON: incidents[{type, source, count_estimate, severity}], "
       "error_rate, notable_lines (max 3). JSON only.")

def explain(tripped, counts, lines=None, png_path=None):
    content = [{"type": "text", "text": ASK.format(tripped=tripped, counts=counts)}]
    if lines:                                       # preferred: send text
        content.append({"type": "text", "text": "\n".join(lines)})
    if png_path:                                    # only when all you have is a screen
        b64 = base64.b64encode(open(png_path, "rb").read()).decode()
        content.append({"type": "image_url", "image_url": {"url": f"data:image/png;base64,{b64}"}})
    r = requests.post(API, json={"model": MODEL, "messages": [{"role": "user", "content": content}],
                                 "max_tokens": 400, "temperature": 0}, timeout=60)
    text = r.json()["choices"][0]["message"]["content"]
    try:
        return json.loads(text)
    except json.JSONDecodeError:
        return {"raw": text}                         # 10-25% failed to parse in my test
The counter is the collector; it never misses. The model is the analyst; it adds the "why" and writes the note a human actually reads.
Wire it into your agent
In agent terms, the counter is a tool (a script that runs a step), "explain what tripped" is a skill (the task list), and your orchestrator decides what to store and who to notify. Store counter totals and the model's JSON in your database so the orchestrator can match repeat patterns faster next time. Route each incident type to the person who owns it, so nobody has to read a full summary.
What about a real server?
I also ran a short read-only test against a staging server. It was inconclusive: no new log lines arrived during the window, so the model was looking at a still screen. It correctly reported nothing in nearly every frame, but there was nothing real to catch, so it doesn't prove anything either way. The synthetic results above are the ones to trust for now. Update: I later ran the hybrid pattern on a live, busy log. See Hybrid log watching on a DGX Spark.
What I'd try next
- A smaller vision model. The 120B model was accurate enough at low volume but slow, about 6 seconds a frame. A smaller VL model should mean more frames and faster explanations.
- Text samples vs. screenshots, head to head. Same trips, same 50 lines, once as text and once as an image, to measure tokens, speed, misreads, and JSON failures.
- A real busy log. Repeat the test once a staging log is actually moving.
More DGX Spark recipes are coming. Follow the DGX Spark section for the next one.
Tips
Measure before you redesign. My CPU spike turned out not to be the stream itself.
Validate model JSON and retry or fall back. Never let a parse failure silently drop an alert. The counter's own alert should go out regardless.
Keep logs local. Running the model on your own Spark means raw logs, IPs, and usernames never leave your network.
Tune thresholds on a quiet day first, so normal background noise (like routine WARN lines) doesn't trip them.
Common questions
So is vision useless for logs?
No. At about 10k lines an hour it caught all 5 incidents by reading the screen alone. It's also the only option when all you have is a screen. It just can't be the collector at high volume.
Would a faster model fix it?
Partly. A faster model gets more frames, but a 50-line screen still can't show 1,700 new lines. The counter is what guarantees nothing is missed. That said, a smaller vision model is the first thing I'd try next.
Why did hybrid precision drop at higher volume?
The counters caught everything, but the model's explanations got noisier on busy screens, for example calling normal WARN background a "ramp." Tighter prompts and text samples instead of screenshots should help.
More guides
AdvancedClaudeBuilding
Call the Claude API in Python and cut costs with prompt caching
Get an API key, make your first Claude Messages API call in Python, then add prompt caching so repeated long prompts cost less and run faster.
About 30 minutes using Claude Console, Claude API docs
AdvancedClaudeBuilding
Build your first MCP server in Python and use it in Claude Desktop
Write a small Model Context Protocol server with the official Python SDK, expose a tool, and connect it to Claude Desktop so Claude can call it.
About 35 minutes using MCP docs, Claude Desktop
AdvancedGrokBuilding
Build a simple RAG pipeline with the xAI Grok API
Answer questions from your own documents: split them into chunks, retrieve the best matches, and have Grok answer with citations via the xAI API.
About 40 minutes using xAI API docs, xAI Console
Occasional notes
Hear when a new guide is up
A short note when a guide is added. No account, and no emails until this form is connected to a real list.